Flowers are essentially tarts. Prostitutes for the bees. (Uncle Monty, Withnail and I) Our tiny garden has only passing acquaintance with sunshine, so about the only plants that really thrive in its dingy clutches are shade-loving ferns. This Japanese painted fern is my current favourite: who needs flowers anyway, when leaves look like this? The colour is spectacular, but …
Category: R
Aug 26
Statistical power
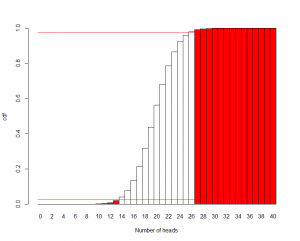
In a recent(ish) post, we saw that if a fair coin is flipped 30 times, the probability it will give us 10 or fewer heads is less than 5% (4.937% to be pointlessly precise). Fisher quantified this using the p value of a data set: the probability of obtaining data (or a test statistic based on those data) at …
Mar 03
Nonlinear regression
Nonlinear regression is used to see whether one continuous variable is correlated with another continuous variable, but in a nonlinear way, i.e. when a set of x vs. y data you plan to collect do not form a straight line, but do fall on a curve that can be modelled in some sensible way by …
Feb 24
Analysis of variance: ANOVA (2 way)
The technique for a one-way ANOVA can be extended to situations where there is more than one factor, or – indeed – where there are several factors with several levels each, which may have synergistic or antagonistic effects on each other. In the models we have seen so far (linear regression, one-way ANOVA) all we …
Feb 24
Analysis of variance: ANOVA (1 way)
Analysis of variance is the technique to use when you might otherwise be considering a large number of pairwise F and t tests, i.e. where you want to know whether a factor with more than 2 levels is a useful predictor of a dependent variable. For example, cuckoo_eggs.csv contains data on the length of cuckoo eggs laid …
Feb 17
Comparison of expected and observed count data: the χ² test
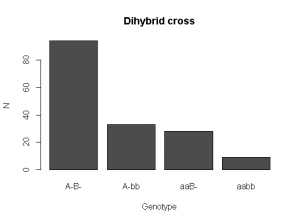
A χ2 test is used to measure the discrepancy between the observed and expected values of count data. The dependent data must – by definition – be count data. If there are independent variables, they must be categorical. The test statistic derived from the two data sets is called χ2, and it is defined as …
Feb 10
Correlation of data: linear regression
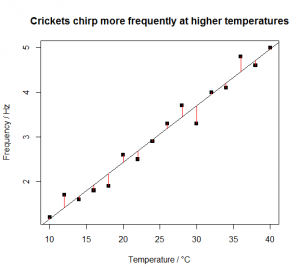
Linear regression is used to see whether one continuous variable is correlated with another continuous variable in a linear way, i.e. can the dependent variable y be modelled with a straight-line response to changes in the independent covariate x: Here b is the estimated slope of the best-fit line (a.k.a. gradient, often written m), a …
Feb 03
Statistical testing
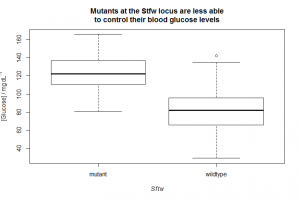
If you want a random yes/no answer to a question, like “who should kick-off this football match?” it’s very common to entrust the decision to the flip of a coin, on the assumption that the coin doesn’t care which side gets the advantage. But what if that trust is misplaced? What if the coin gives …
Feb 03
Comparison of means: the t test
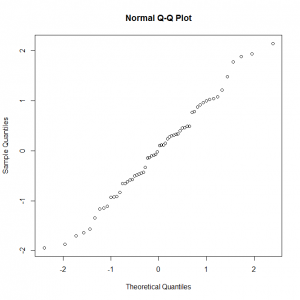
A t test is used to compare the means of two data sets, and it relies on calculation of a test statistic called t. This statistic is derived from the two data sets and it is defined as the difference between the means of the two data sets, x̅1 and x̅2 (or the difference between a mean x̅ and …
Feb 03
Comparison of variances: the F test
An F test is used to compare the variances of two data sets: As it is used to compare variances, the dependent data must – by definition – be numeric. As it is used to compare two distinct sets of data, these sets represent the two levels of a factor. The test statistic we use …
- 1
- 2

![Barnsley fern [Public domain]](https://www.polypompholyx.com/wp-content/uploads/2015/08/barnsley_fern-300x300.png)
![Coin distribution overlaps for increasing sample size [CC-BY-SA-3.0 Steve Cook]](https://www.polypompholyx.com/wp-content/uploads/2015/08/coin_overlap_for_different_sample_sizes-300x300.png)
![Species-area relationship for Caribbean herps [CC-BY-SA-3.0 Steve Cook]](https://www.polypompholyx.com/wp-content/uploads/2014/03/species_area_relationship_caribbean_herps-300x300.png)
